Saved once, served many times
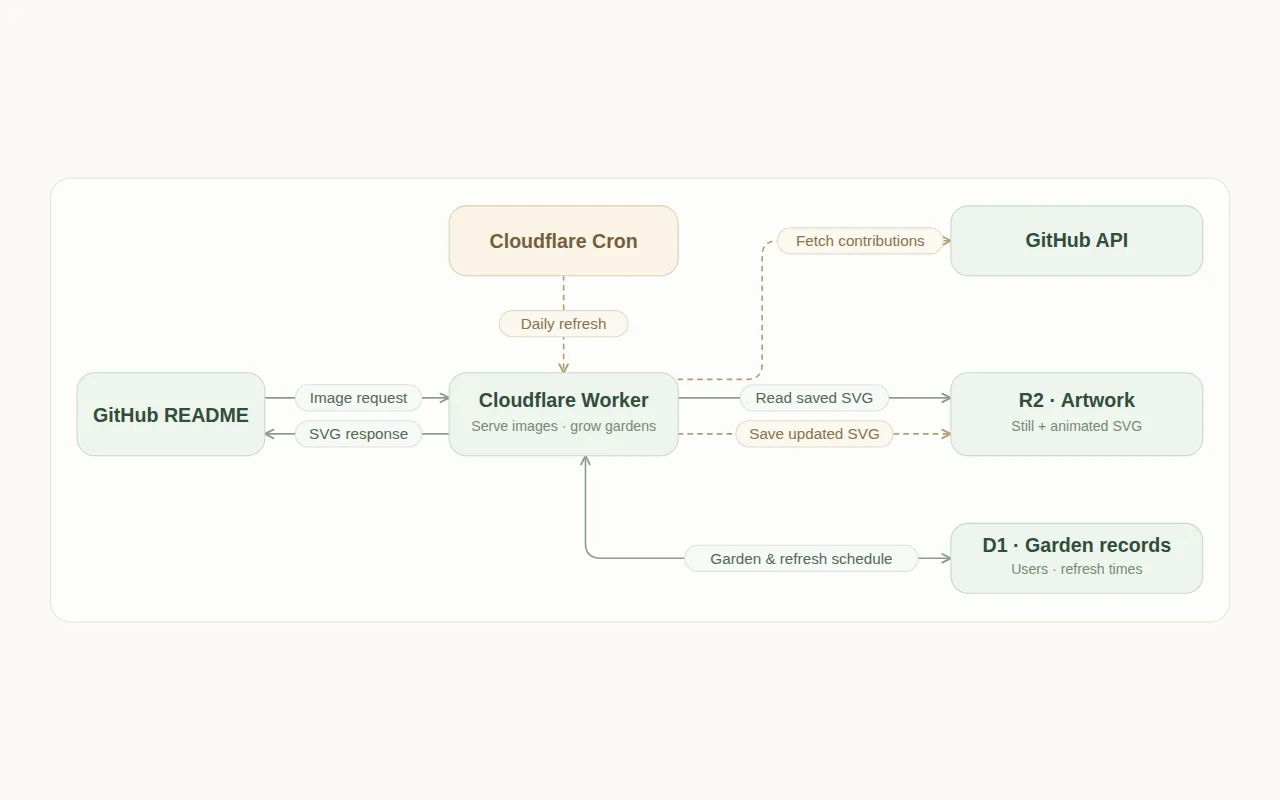
A request only reads the saved SVG from R2, with an ETag so repeats are cheap. GitHub is called on the first visit and in the daily repaint, not when a README is viewed.
A small service that turns your GitHub contributions into a watercolor plant. Every day of the year is a leaf, and the more you did that day, the deeper its green. Paste one image line into your profile README and the picture keeps itself up to date.

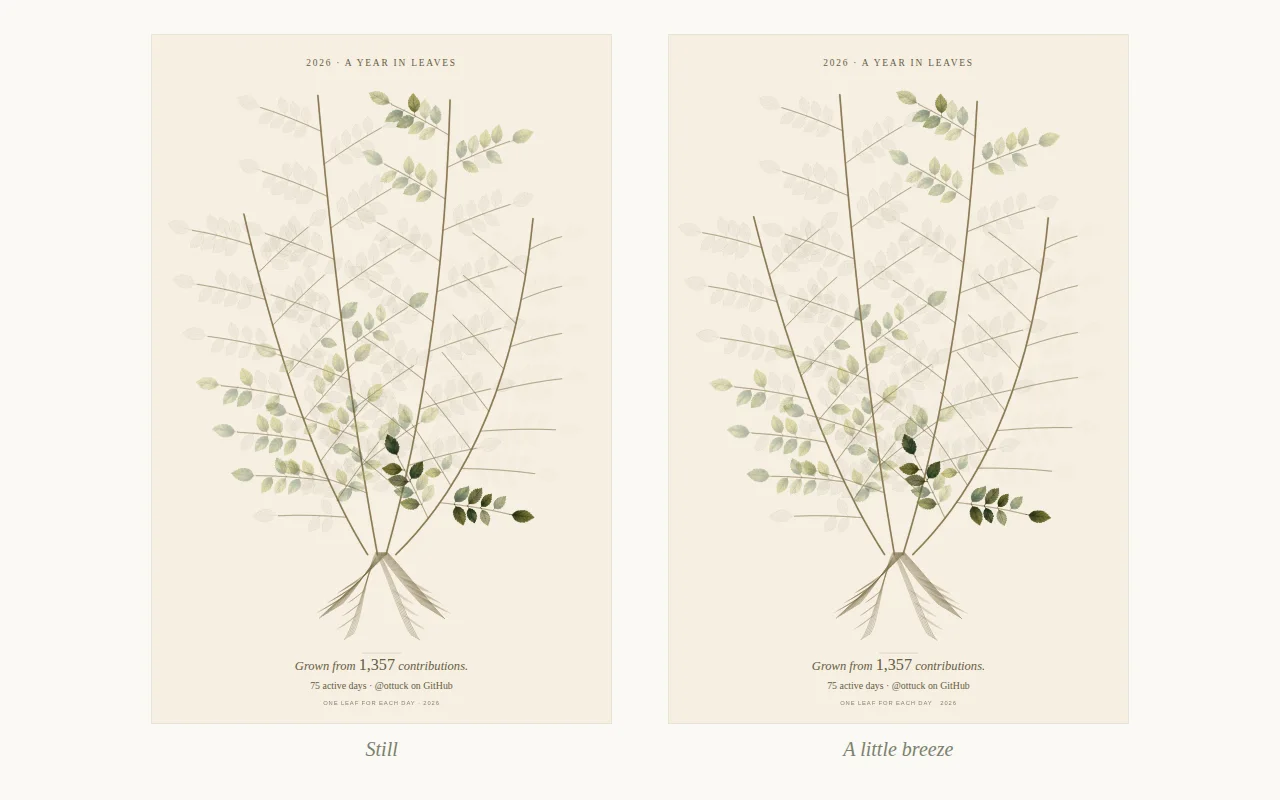
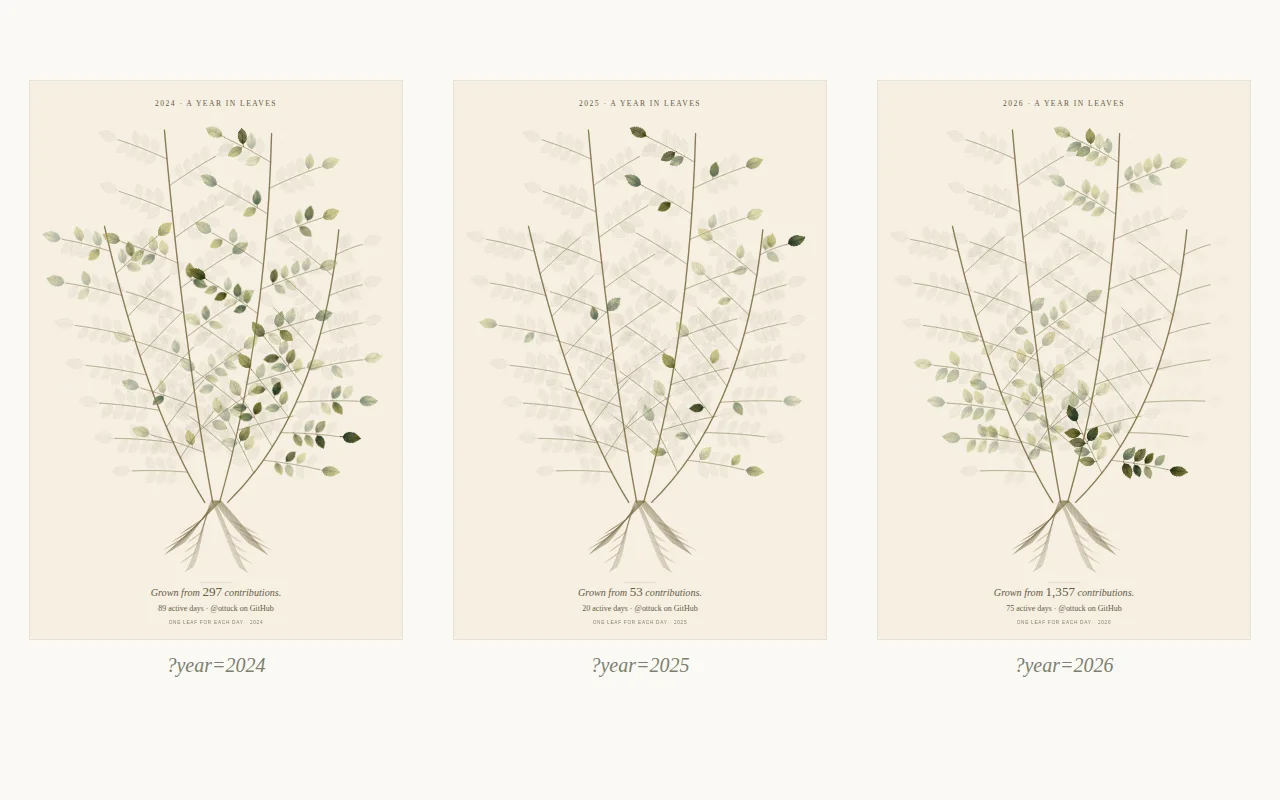
A contribution graph is a grid of green squares. I wanted something I'd enjoy looking at, so GitLeaf paints the year as a plant: a small leaf for each day, shaded by how much happened, and a bigger leaf at the end of each branch for the week. Days that haven't come yet are faint outlines, and the plant's caption counts the year's contributions.
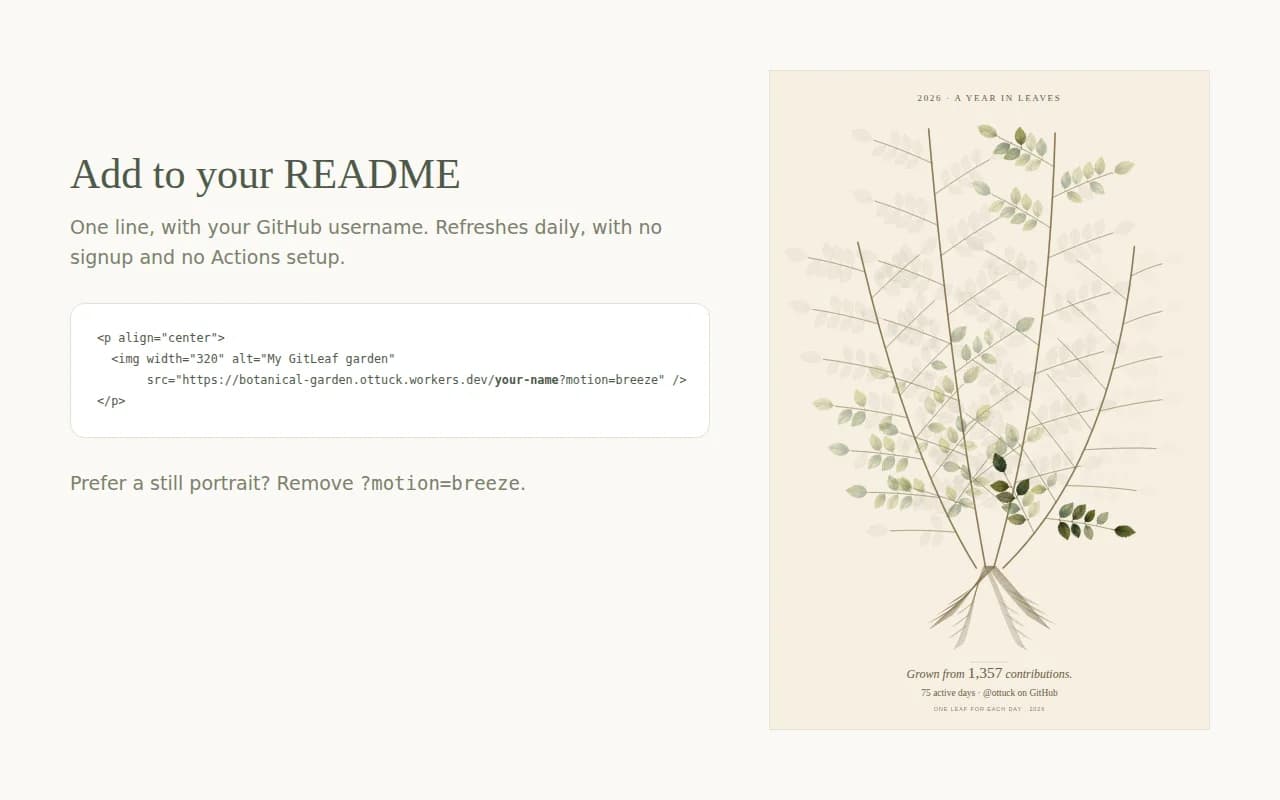
It's made to sit in a profile README. You paste one image line with your username, with no sign-up and no GitHub Actions. The first time the image is requested, the service reads your contributions, paints the plant and saves it. After that it's repainted once a day under the same URL, so your README never changes and nothing is committed.
The leaves are eight watercolor leaf shapes in five shades, made with an AI image tool. The code lays them out on four stems and fills in one per day. The whole picture is a single SVG file, so it works as a plain image in a README, where scripts and outside requests are blocked.
A request only reads the saved SVG from R2, with an ETag so repeats are cheap. GitHub is called on the first visit and in the daily repaint, not when a README is viewed.
If GitHub fails or sends incomplete data, the old picture stays and the retry waits longer each time, from an hour up to a day. A lease in D1 keeps two overlapping requests from painting the same garden twice.
Cron wakes every ten minutes and handles up to four gardens that are due, each once a day after 00:20 UTC. The work stays small, and the limits are in the README for when more people use it.
A script compares a live picture with a fresh GitHub response: every day's count and shade, the weekly leaves, future days and the total. The 20 tests run without touching GitHub, and cover leap years, year-end rushes and outages.
Counts are GitHub contributions, not only commits. Private activity only shows if the service's GitHub token can see it. The pictures use my own account.